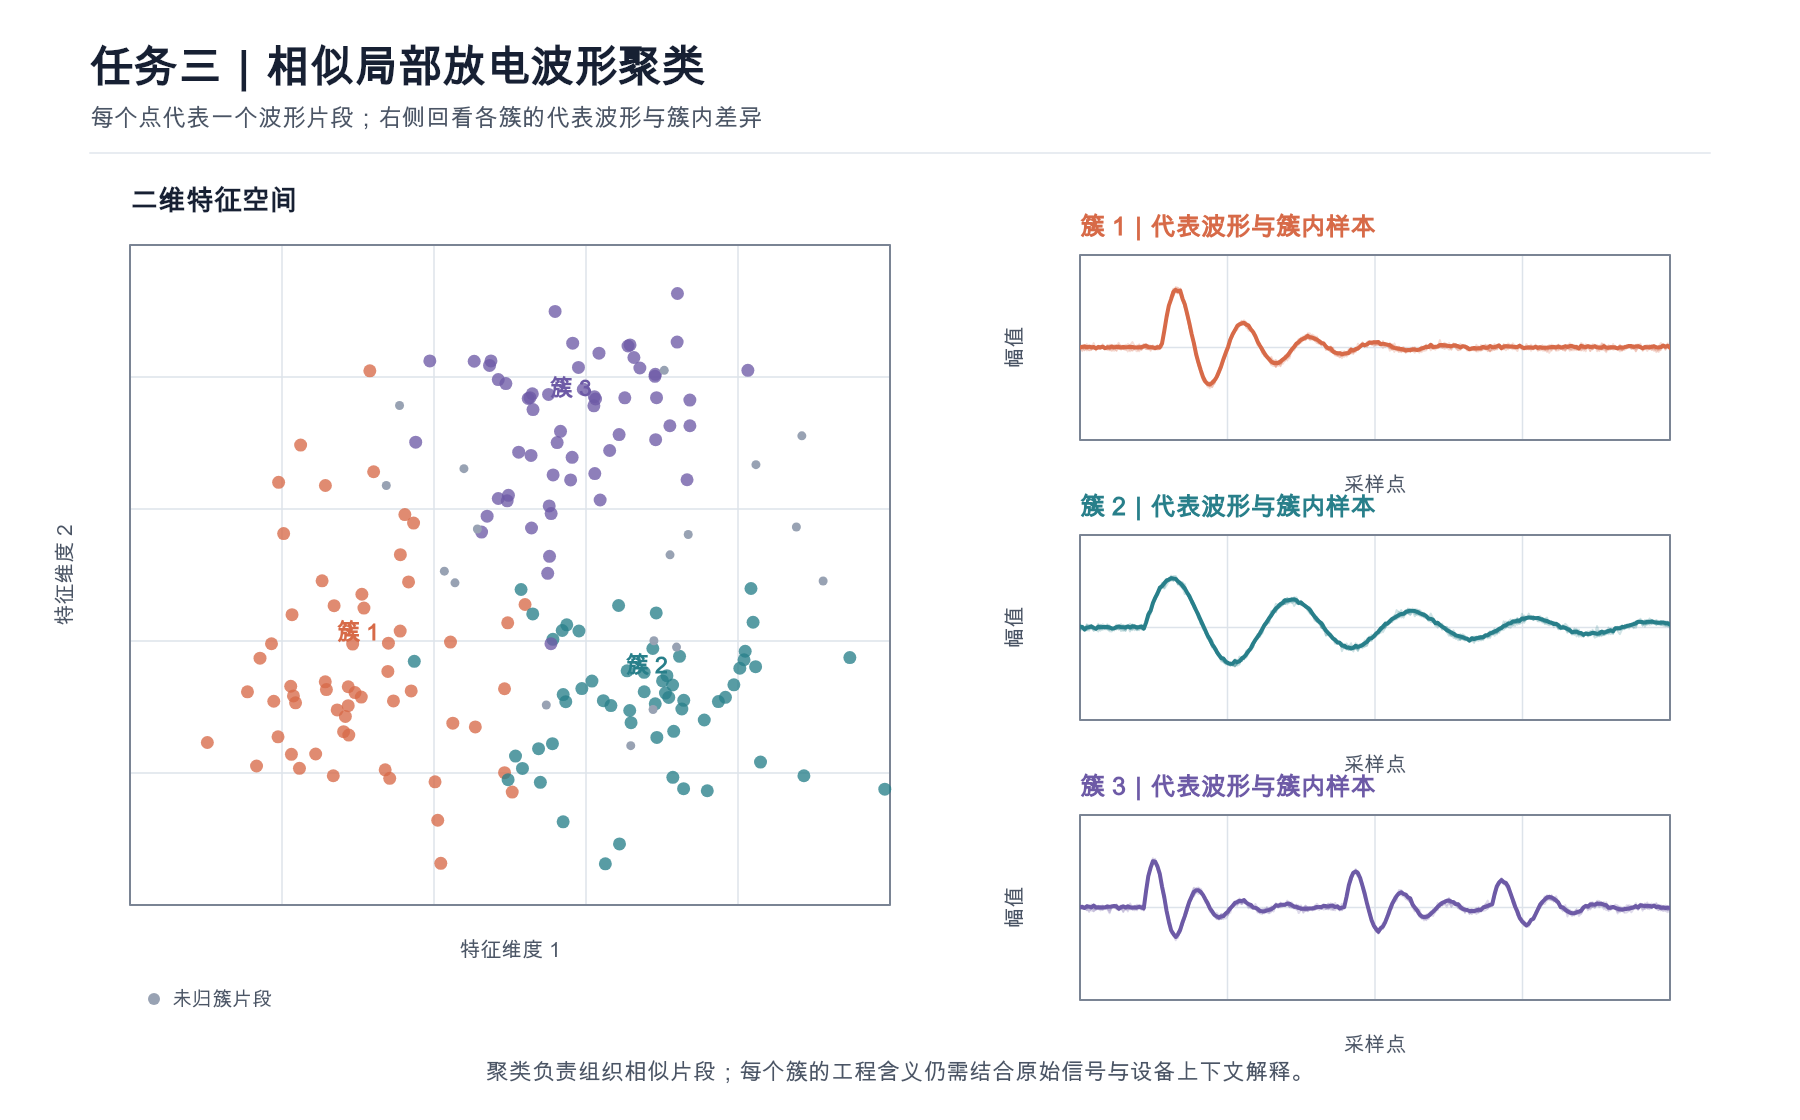
A multi-domain feature and clustering workflow that groups similar discharge candidates, preserves outliers and returns every cluster to representative waveforms for expert review.
Engineers cannot inspect thousands of candidate events one by one, and new signal families may not fit a predefined classifier. The analysis needs to compress the review space without pretending that a cluster ID is a physical diagnosis.
What I did
Implemented time-, frequency- and wavelet-domain feature pipelines.
Result / limit
Kept cluster assignments, outliers and reduced projections available for engineering interpretation without publishing unsupported quality scores.
Task 3 · Clustering. A fixed-seed illustration makes the route from feature space back to representative waveforms easy to inspect.
01 · A
Problem
Engineers cannot inspect thousands of candidate events one by one, and new signal families may not fit a predefined classifier. The analysis needs to compress the review space without pretending that a cluster ID is a physical diagnosis.
01 · B
Context
At an anonymized industrial measurement technology company, clustering followed preselection and classification so domain engineers could compare distributions, representative waveforms and outliers. Customer and device details remain private.
02
Why it matters
Different discharge mechanisms can form distinct waveform families, while noise and unusual operating conditions create their own structures. Clustering reduces the number of examples an expert must inspect and can reveal unfamiliar groups, but only if the result stays connected to the original waveform and measurement context.
Explore technical detailsWhat made it hard · System path · Key trade-offs
02 · B
What made it hard
01
Raw waveform distance alone is sensitive to phase, amplitude and duration.
02
Feature choice and scaling can change the apparent cluster structure.
03
Density-based noise points are not automatically non-discharge events.
04
Two-dimensional projections help inspection but distort high-dimensional distance.
03
My approach
System path
01
Describe
Extract time-, frequency-, spectral- and wavelet-domain feature families
02
Represent
Scale robustly and compare original feature space with reduced views
03
Group
Apply density-based and hierarchical clustering while preserving outliers
04
Review
Inspect medoids, waveforms, spectra and wavelet signatures for each group
Feature-to-review pipeline
Clustering organizes attention; it does not name the physics
Complementary feature families are scaled, grouped and then traced back to representative source waveforms for expert interpretation.
Waveform segments
Feature families
Robust scaling
HDBSCAN / hierarchy
Medoids + originals
01traceable
Waveform segments
Candidate events with source links
02complementary
Feature families
Time, spectrum and wavelet descriptors
03comparable
Robust scaling
Prevent one magnitude from dominating
04uncertainty
HDBSCAN / hierarchy
Keep dense groups and outliers
05expert review
Medoids + originals
Return each group to real waveforms
Python
NumPy
SciPy
scikit-learn
HDBSCAN
PCA
UMAP
Wavelets
Key trade-offs
01
Use feature families, not one magic descriptor
Time, spectral and wavelet views capture complementary aspects and remain individually inspectable.
02
Preserve unassigned points
Forcing every event into a cluster hides uncertainty and can erase rare patterns.
03
Return to the waveform
Embedding plots organize attention; representative raw signals remain the object of engineering review.
04 · A
My contribution
Implemented time-, frequency- and wavelet-domain feature pipelines.
Compared density-based, hierarchical and reduced-space clustering workflows.
Built representative-signal views so engineers could review clusters against original waveforms.
04 · B
What was implemented
Implemented an inspectable post-analysis pipeline from feature extraction to representative waveform review.
Kept cluster assignments, outliers and reduced projections available for engineering interpretation without publishing unsupported quality scores.
Three views, three jobs
A clean embedding is not the final evidence
The original feature space supports grouping, the 2D projection supports navigation, and the raw waveform supports engineering judgment.
Original feature space
2D projection
Representative waveform
01analysis
Original feature space
Distances used by the clustering workflow
02orientation
2D projection
A lossy map that helps humans navigate
03interpretation
Representative waveform
Signal shape, spectrum and context
04 · C
Lessons learned
01
A clean two-dimensional cluster picture can be less truthful than a messy but traceable review set.
02
Unsupervised analysis becomes useful when it reduces expert work while preserving uncertainty.
What I can share
I cannot publish customer recordings, throughput or cluster-quality figures from this confidential work. I share the feature, clustering and representative-waveform review pipeline through a fixed-seed illustration.